response
= await feedIterator.ReadNextAsync();
foreach (var item in response)
{
results.Add(item.id, item.views);
}
}
}
return results;
}
```
I created a new Azure Function, also on a timer, that would take this data, turn it into a HTML table, and email it to me once a day.
```csharp
[FunctionName("SendDailySummary")]
[FixedDelayRetry(5, "00:00:10")]
public static async Task SendDailySummary(
[TimerTrigger("0 0 5 * * *")] TimerInfo timerInfo,
ILogger log)
{
string cosmosEndpoint
= Environment.GetEnvironmentVariable(
"CosmosEndpointUri");
string cosmosKey
= Environment.GetEnvironmentVariable(
"CosmosPrimaryKey");
DataStorage data = new DataStorage(cosmosEndpoint, cosmosKey);
await data.Init();
var results = await data.GetViewsByDay(-7);
string connectionString
= Environment.GetEnvironmentVariable(
"EmailServiceConnectionString");
var emailClient = new EmailClient(connectionString);
var currentDateTime = DateTimeOffset.Now.ToString("f");
StringBuilder htmlResults = new StringBuilder();
StringBuilder plainResults = new StringBuilder();
string chartURL = Charting.Make7DayLineChart(results);
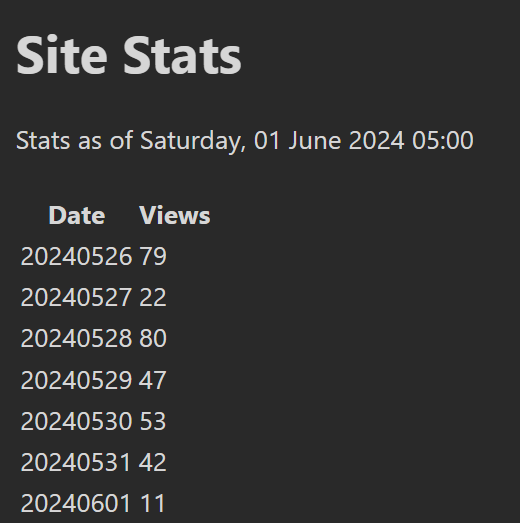
htmlResults.Append("" +
"| Date | Views | " +
"
");
plainResults.Append("Date, Views\n");
foreach (var row in results)
{
htmlResults.Append($"| {row.Key} | " +
$"{row.Value} |
");
plainResults.Append($" - {row.Key}, {row.Value}\n");
}
htmlResults.Append("
");
plainResults.Append("\n\n");
string htmlMessage = "Site Stats
" +
$"Stats as of {currentDateTime}
" +
"![]()
"
+ htmlResults.ToString() + "";
string plainMessage = "Site Stats\n\n" +
$"Stats as of {currentDateTime}\n\n" +
plainResults.ToString() + "\n\n"
+ $"Chart available at: {chartURL}";
EmailRecipients recipients = new EmailRecipients();
recipients.To.Add(
new EmailAddress(
Environment.GetEnvironmentVariable(
"SendAnalyticsReportsTo"),
Environment.GetEnvironmentVariable(
"SendAnalyticsReportsName")));
EmailContent content = new EmailContent("Site Stats");
content.PlainText = plainMessage;
content.Html = htmlMessage;
EmailMessage messageToSend
= new EmailMessage(
"DoNotReply@messaging.duncanmackenzie.net",
recipients, content);
await emailClient.SendAsync(
WaitUntil.Started, messageToSend);
}
```
This works, but it’s a little boring.
I did some more digging around and found [Quick Charts](https://quickchart.io/documentation/), which lets me construct a chart using their .NET SDK, and get a URL that I can stick into my email. The full source code involved is up in [my GitHub repo](https://github.com/Duncanma/PhotoWebhooks/blob/main/Charting.cs), but the result is definitely more pleasing.
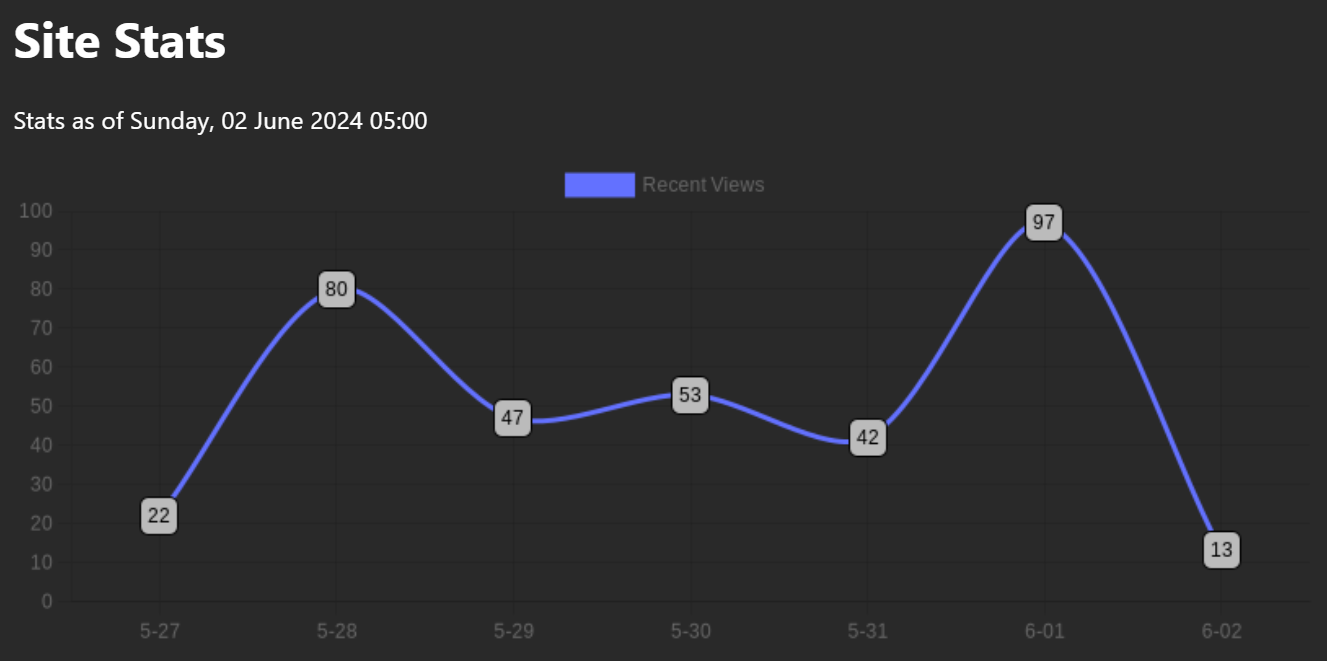
I should probably exclude the current day, since it will always seem like a sharp drop with only 5 hours of data.
## What’s next?
So much.
- I should create a web page online with my most recent stats, so I can go and check it out instead of just relying on daily summary emails.
- I need to write all the other aggregation code by week, month, referrer, country, new vs returning, browsers, page, etc.
- I would like to add in some ‘comparison’ to previous period, so that I can see if one week has 20% more traffic than the previous and similar information.
- I **must** go back and clear out the IP address once I’ve done the country lookup.
- And probably much more.
While the hosting of the functions and data is costing me pennies per day, this has taken quite a few hours to code up. Just paying someone like Plausible would be more cost effective (and end up with more features), but my personal time is free. This is enjoyable, so it’s not really intended to save me money. If you have the need to do analytics **without** using any third-party though, an approach like this could be suitable.